Data-Driven Gym: Scraping and Analysing Gym Attendance with Prometheus
Exploring how I built a Prometheus exporter to track live attendance at my local gym. From data scraping to trend analysis, here’s how I turned raw numbers into actionable insights.
Introduction
If you’re anything like me, you tend to be a bit curious about how things work behind the scenes. Maybe it’s a slight hacker tendency or just a habit of not taking data at face value. So when I saw the digital attendance counters on the REDACTED Fitness application, I couldn’t help but wonder how accurate they really were.
I built a Prometheus exporter that scrapes attendance data from all REDACTED Fitness locations. What started as a simple attempt to verify if the counters ever hit zero quickly transformed into a comprehensive data gathering initiative. The project now lives on my home server, integrated with my existing homelab infrastructure, collecting valuable insights about gym attendance patterns across different locations.
In this post, I’ll walk you through how this project came to be, what I discovered, and how you might benefit from similar data about your own gym.
The Problem & Hypothesis
My scepticism began with a simple observation, people were being counted when entering the gym, but what about when they left? I suspected various scenarios, such as tailgating (when multiple people exit but only one scan occurs) might be causing inaccuracies in the reported numbers.
My primary hypothesis was straightforward, if the counting system was accurate, we should see the numbers hit zero at some point, likely during overnight hours when the gym is empty. If the numbers never reached zero, it would suggest a cumulative error in the system.
This might seem trivial, but accurate attendance data is valuable for both gym-goers (who want to avoid crowds) and gym operators (who need to understand usage patterns for staffing and expansion decisions).
Finding the Data
Whilst the website lists the live tracker functionality all over it, all the links direct you to download the app. This is fair, this gym is unlike most traditional gyms with lock-in contracts and franchises. REDACTED instead has their app that they strongly advertise, and no doubt a lot of the company’s valuation would be based around the application they have to track all aspects of their members. This left me to try and reverse engineer how to find the count.
Based on the page HTML structure, it was evident that the REDACTED website is made in WordPress, so I started to look in all of the usual places. I found the sitemap, but after looking through it, there were no links to the live counter.
My investigative instincts kicked in. I then looked at other common locations where hidden resources might be lurking. Maybe if they were hiding it from the sitemap, they’d have it in the robots.txt file to prevent scrapers from finding it. No luck there either.
Before I went full nuclear and started brute-forcing likely URLs with a tool like GObuster, I had an idea. Just because the URL wasn’t listed in the current sitemap didn’t mean it hadn’t always been there. I wrote a quick and dirty script to search through public archives from the Wayback Machine, specifically looking for any sites with the string “live” in the URL.
Thankfully this script yielded two results. Even better, one of them happened to be exactly the page I was looking for. When I accessed the page, I was pleasantly surprised. The returned HTML was quite nice well-structured and formatted in a way that made scraping straightforward, such as <span data-live-count="Elliot" class=" relative text-4xl text-black font-bold">64</span>.
Page Strucutre
Each gym’s live count is represented by a span element. The data-live-count attribute contains the name of the gym (e.g., "Elliot"), and the actual count is stored as the inner text of that element (e.g., 64).
The live counter website includes a dropdown to choose your gym, but thankfully it has all of the gym counts included in the HTML (the elements are just hidden until you choose that gym). Using this structure, I could use BeautifulSoup (BS4) to scrape one page and create a dictionary with all of the counts. This discovery meant I didn’t need to send multiple complex requests or implement intricate scraping logic. The data was right there, just waiting to be extracted.
There are a few quirks in how the counts are shown. Most notably, when a gym has zero occupants the span doesn’t display a 0. Instead, it appears completely blank. This may be a deliberate decision to avoid displaying potentially misleading or negative numbers. For example, if the entry and exit systems become unsynchronised due to tailgating as discussed previously, the displayed count might drift below zero. Hiding the count when it falls below one could be a simple workaround to prevent this from being shown publicly.
Technical Implementation
Building the exporter was relatively straightforward. I created a Python script that:
- Makes requests to the REDACTED Fitness website at regular intervals
- Parses the HTML to extract the current attendance numbers for each location
- Transforms this data into Prometheus metrics
- Exposes these metrics via an HTTP endpoint that Prometheus can scrape
For the backend infrastructure, I leveraged my existing Prometheus and Grafana setup. Prometheus handles the data collection and storage, while Grafana provides visualization capabilities with customisable dashboards. This allowed me to add the gym metrics alongside my existing homelab monitoring with minimal additional configuration.
Project Evolution
When February rolled around, the project took on new significance. The annual influx of “New Year’s resolution warriors” provided a natural experiment in gym attendance patterns. I watched with interest as the numbers swelled in early January, peaked in mid-January, and then gradually declined through February.
This phenomenon transformed my project from a simple verification tool into a longitudinal study. I began tracking retention rates, comparing month on moth data, and monitoring how different locations handled the seasonal surge.
But I ran into a snag I didn’t catch until it was too late. My Prometheus container was set up with a short data retention window, because originally it was just logging short-term metrics like Minecraft server performance or CPU usage. In the Docker config for prometheus-docker, I had the retention set like this:
1
Retention Time: 90d
That meant any data older than 90 days was automatically wiped. I didn’t realise what was happening, and by the time I caught it (about two months later) I’d already lost all the January and February data. That included the entire New Year’s resolution spike, which was the whole point of tracking it in the first place.
I’ve sorted it now. I bumped the retention up to 10 years:
1
Retention Time: 10y
I’ve got the disk space for it, so may as well keep the data. Now everything gets logged long-term, and I won’t get caught out again when I actually want to compare things across years.
Practical Applications
Beyond satisfying my curiosity, this project has delivered tangible benefits:
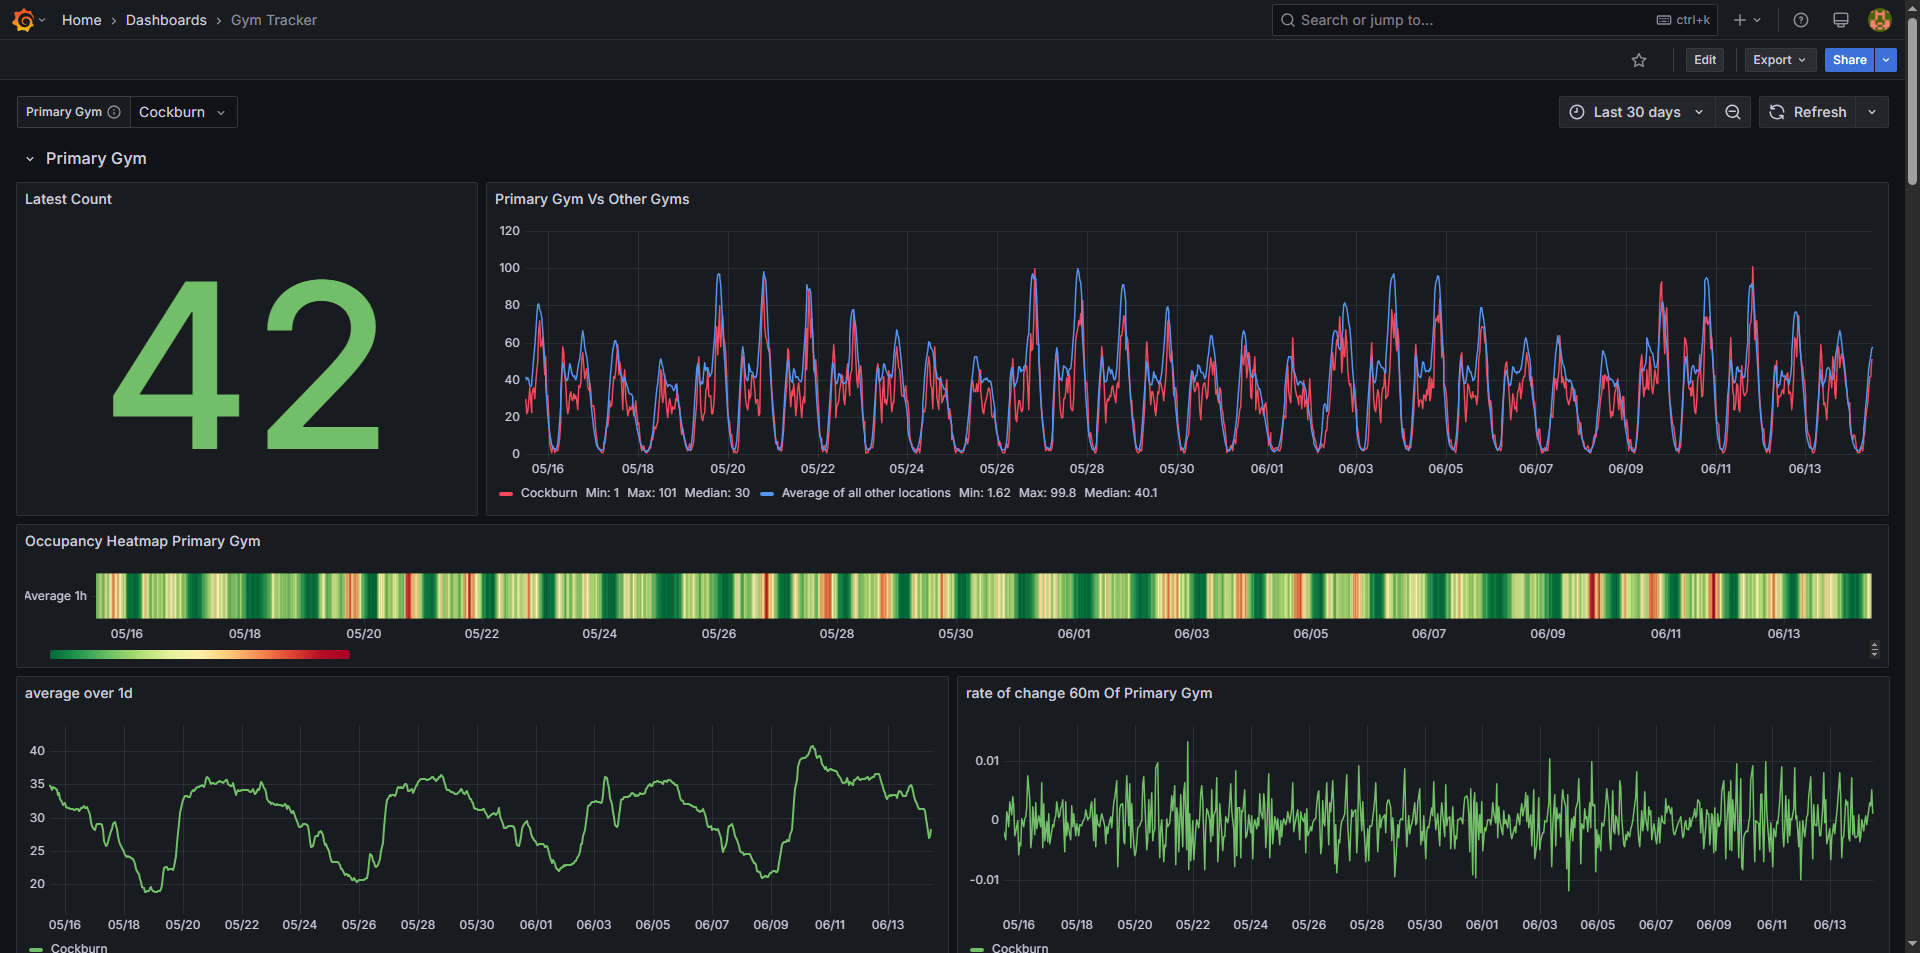
For me personally, I can now identify the optimal times to visit each REDACTED location. For example, I discovered that my local gym is consistently far busier on Mondays than any other day of the week and as such I now have that as a permanent rest day in my routine. Tuesdays, are also quite busy so I usually aim to do legs on Tuesday as the leg machines are often less in demand than other machines.
The location-specific insights are particularly valuable. Each gym has unique patterns based on its location, demographics, and facilities. The CBD locations show clear business-hour patterns, while suburban locations have more consistent attendance throughout the day with peaks after work hours.
I’ve even begun to recognise patterns related to weather, attendance drops significantly during extremely hot days and spikes when outdoor exercise would be uncomfortable.
These insights help me plan my workouts efficiently, avoiding peak times when equipment availability might be limited.
Findings & Insights
The first major revelation? My hypothesis was correct-the numbers never hit zero, even during the middle of the night when the gym was certainly empty. This confirmed my suspicion about counting inaccuracies.
But the data revealed much more interesting patterns beyond this initial finding:
- Each location has distinct “personality traits” in terms of attendance patterns
- Monday evenings are consistently the busiest across all locations
- Saturday afternoons are surprisingly quiet at most locations
- There’s a noticeable drop in attendance during public holidays
- Some locations see sharp spikes during lunch hours on weekdays, while others have a more gradual distribution
- Gyms tend to be busiest at the start of the week, especially on Mondays, and gradually taper off as the week progresses
This downward trend is one of the clearest patterns across nearly every location. Mondays often flirt with each gym’s all-time highs, while by Thursday or Friday things are much quieter. You can see this clearly in the screenshot below, but it’s even more apparent in the second example in this section, where the view is narrowed to a single month. With the shorter timeframe, the weekly rhythm stands out much more clearly.
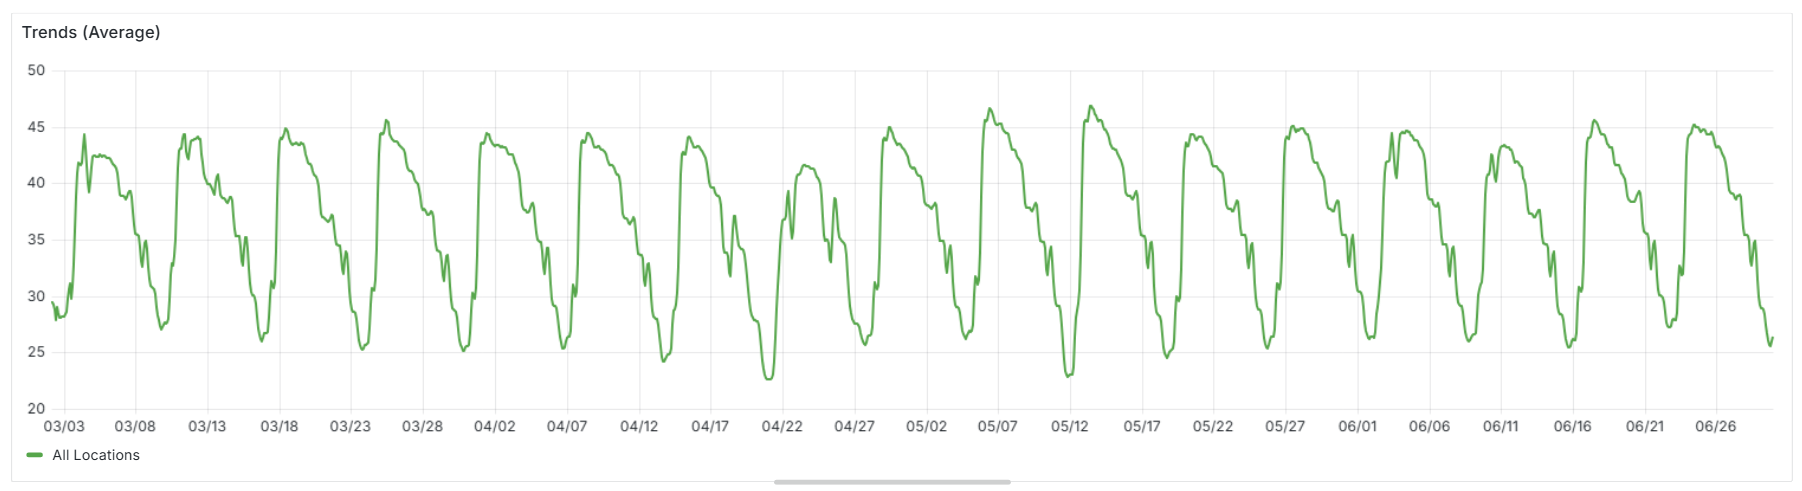
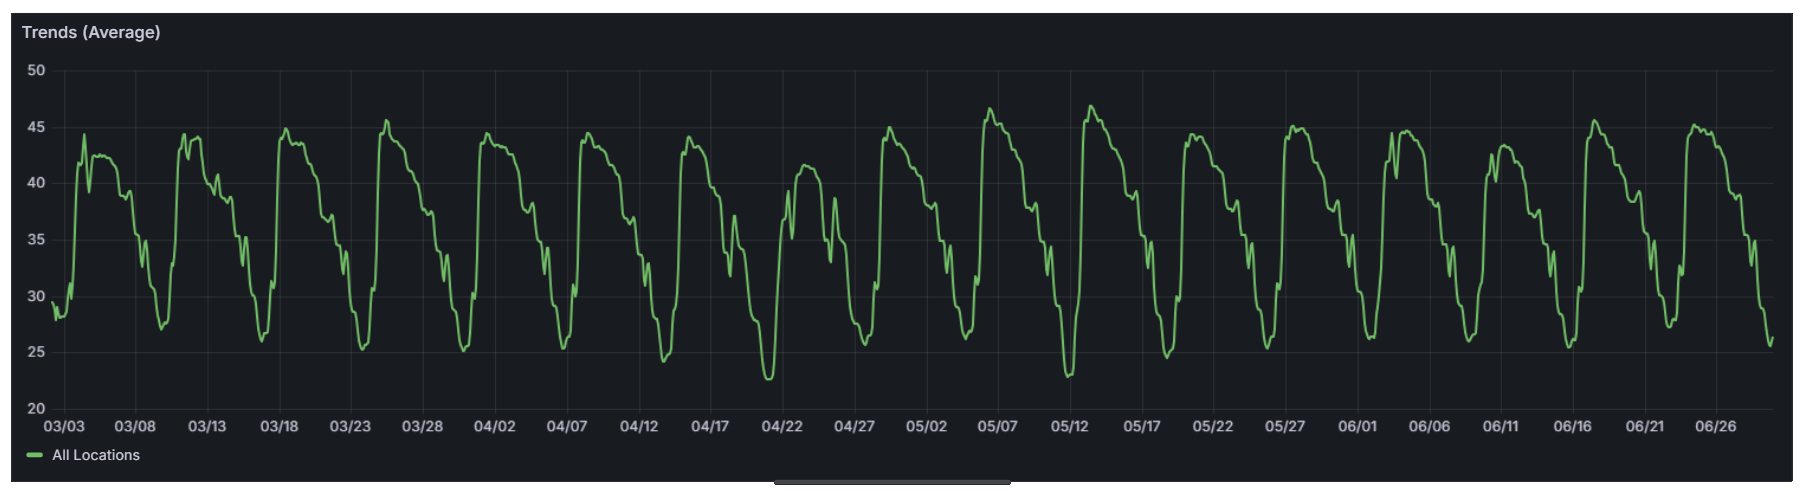 Week-on-week gym attendance trends over a three-month period. The steady drop-off from Monday through to the weekend.
Detecting and Diagnosing Anomalies
The data also serves as an effective monitoring system for identifying operational issues. By calculating the rate of change (derivative) of attendance numbers across locations, as well as comparing week-on-week trends and differences between locations, anomalies become immediately apparent. Over the past few months, I’ve observed distinct categories of anomalies in the data:
1. The Overrun
An overrun happens when the live count at a gym suddenly spikes well beyond what would normally be possible. This type of error has surprisingly occurred a few times.
The most notable example was on the 2nd of March, when all locations outside of Western Australia began counting up rapidly and eventually exceeded their all-time highs by a significant margin. Then, at around 12:30 PM local time, every gym abruptly snapped back to a more typical number.
This kind of behaviour suggests something went wrong in the counting backend. The sharp reset back to expected values makes it likely the issue was identified and corrected mid-day.
You can also see a more subtle example of this in the same dataset on the 7th of March, where there’s a short-lived but noticeable spike. These events aren’t isolated either, the same extreme overrun pattern happened again on the 2nd of July 2025, where many locations reported multiple times their usual counts around 6 PM. Since this occurred during peak gym hours, the inflated values appeared much more dramatic than the earlier midday examples, making the anomaly far more obvious in the data.
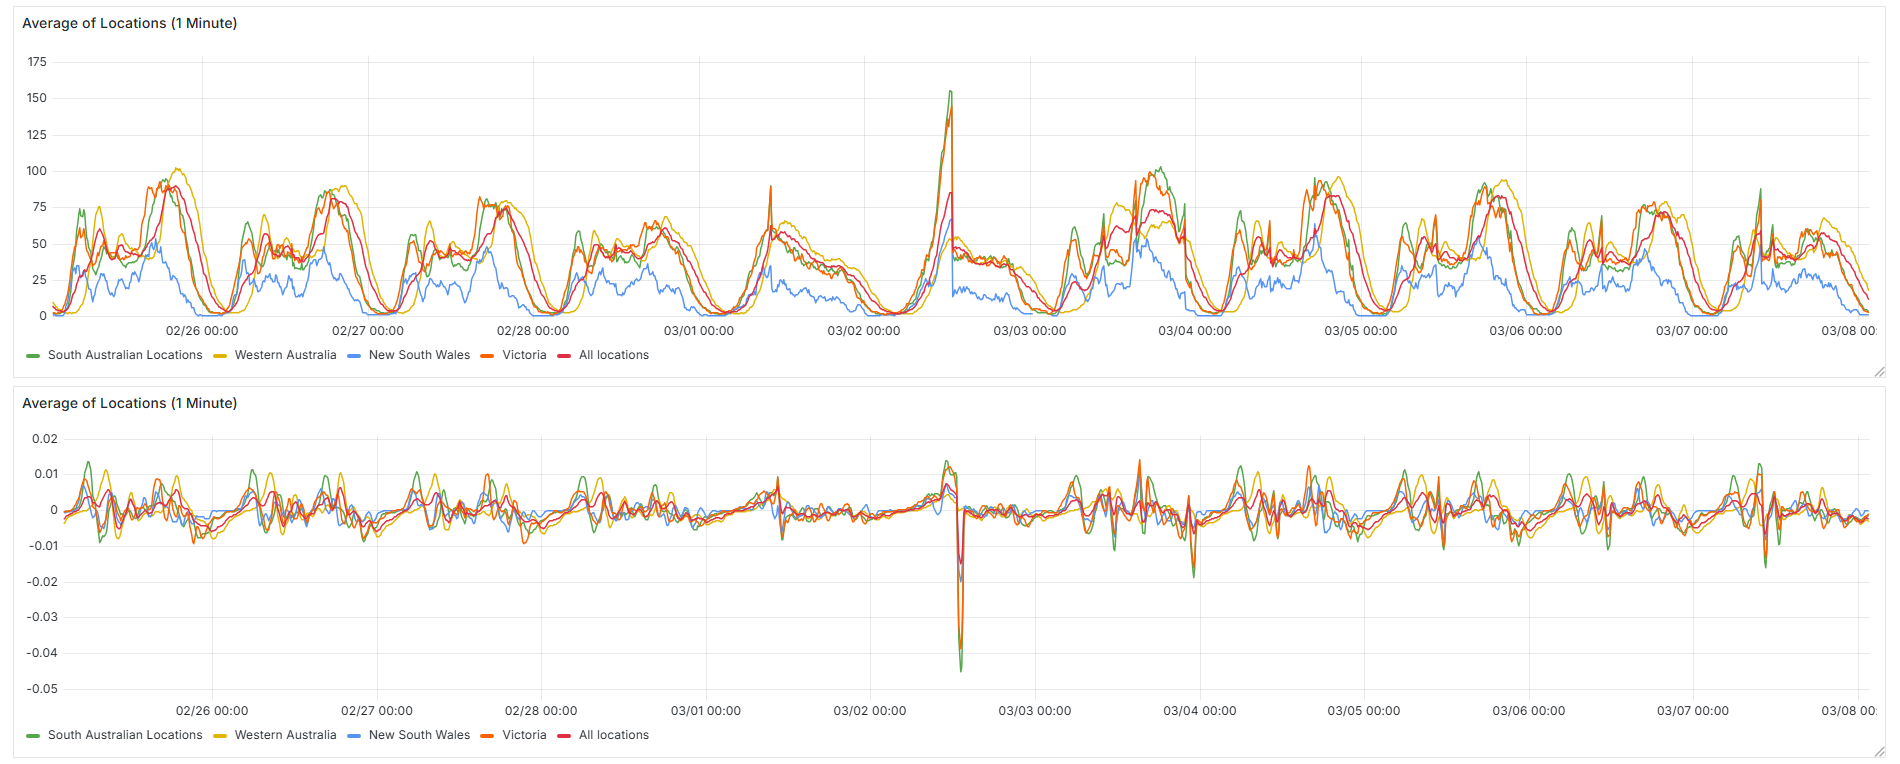
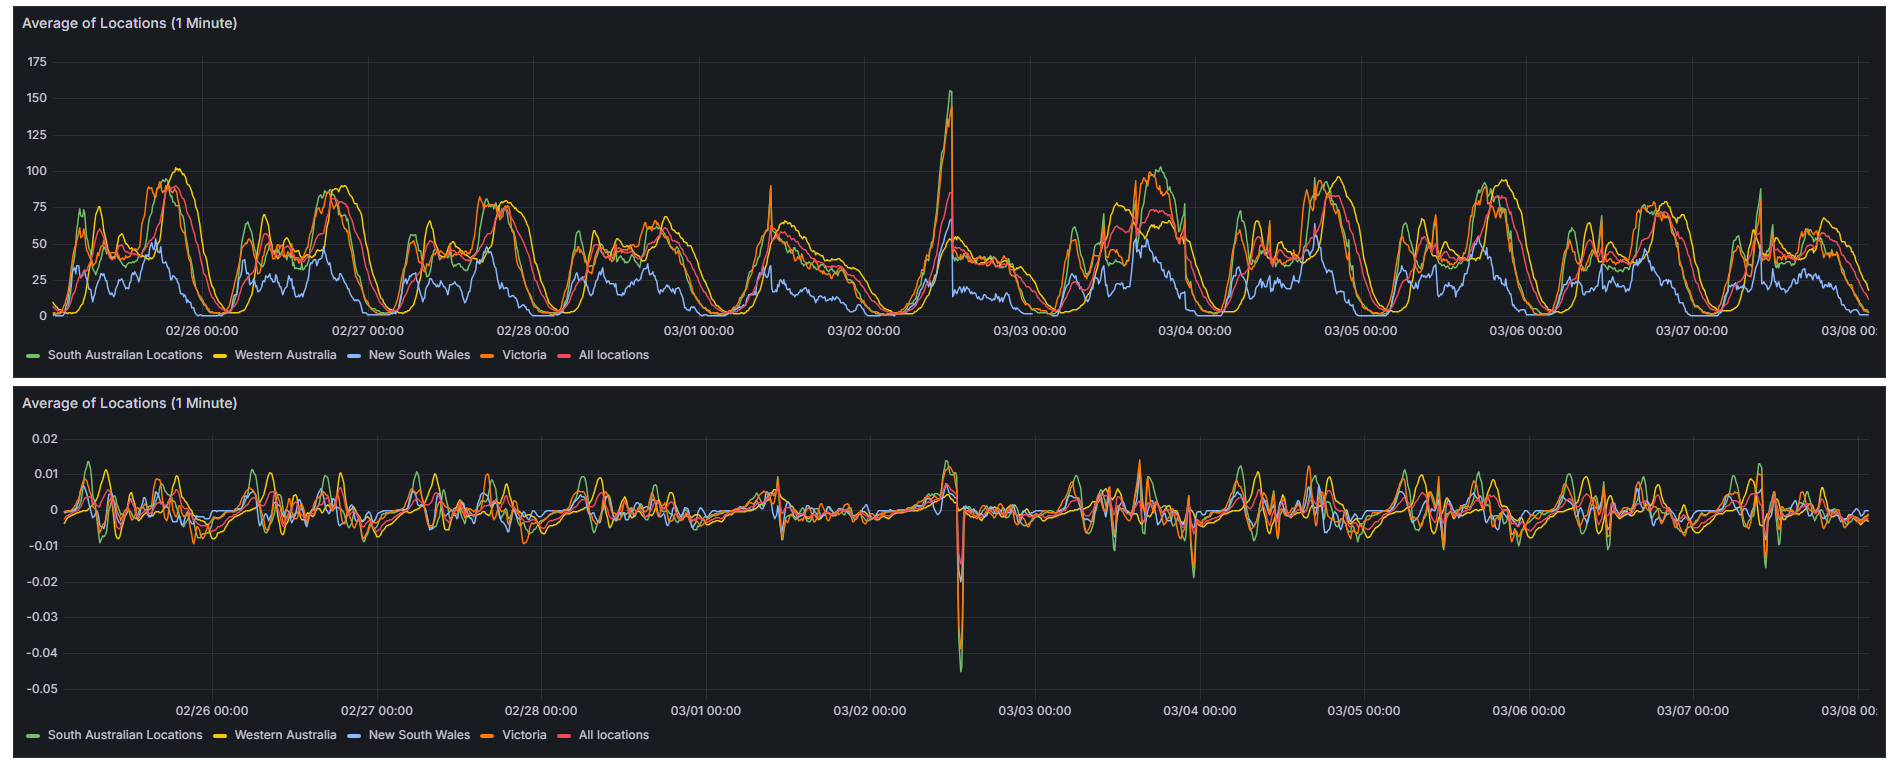 All locations outside of Western Australia over runnning by up to multiple times their previous highest, before sharp correction
2. When the Data Goes Dark
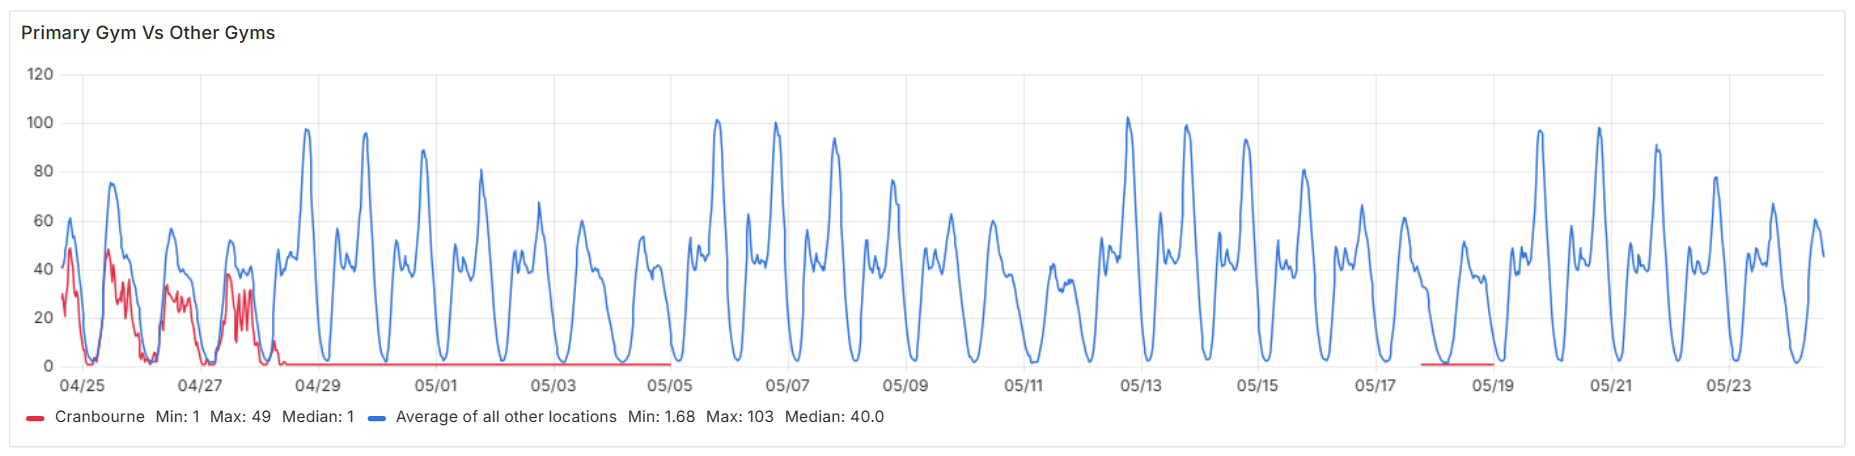
The second type of anomaly is when check-ins stop entirely. While it’s normal to see no new entries around 4 AM, seeing this happen during the middle of the day without explanation is a strong signal that something has gone wrong. If a location usually has a steady pattern of activity and that suddenly stops, it often points to a scanner failure.
Short interruptions can sometimes be caused by technical glitches, but longer periods with no data are more commonly due to temporary closures. Still, if the downtime happens during peak hours and with no notice, it’s always worth investigating.
In the example below, one location’s count stopped updating altogether and remained blank for an extended period. It stood out clearly in the data. A quick search of the gym revealed an official announcement confirming the reason:
We are so excited to announce that REDACTED Fitness Cranbourne is getting a makeover!
To get to work, our Cranbourne gym will be closed from 8:00am Monday 28/04/2025 and we will reopen at 7:00am Friday 20/06/2025.
This kind of planned closure is rare but detectable. The key sign is a complete lack of check-in activity over many days.

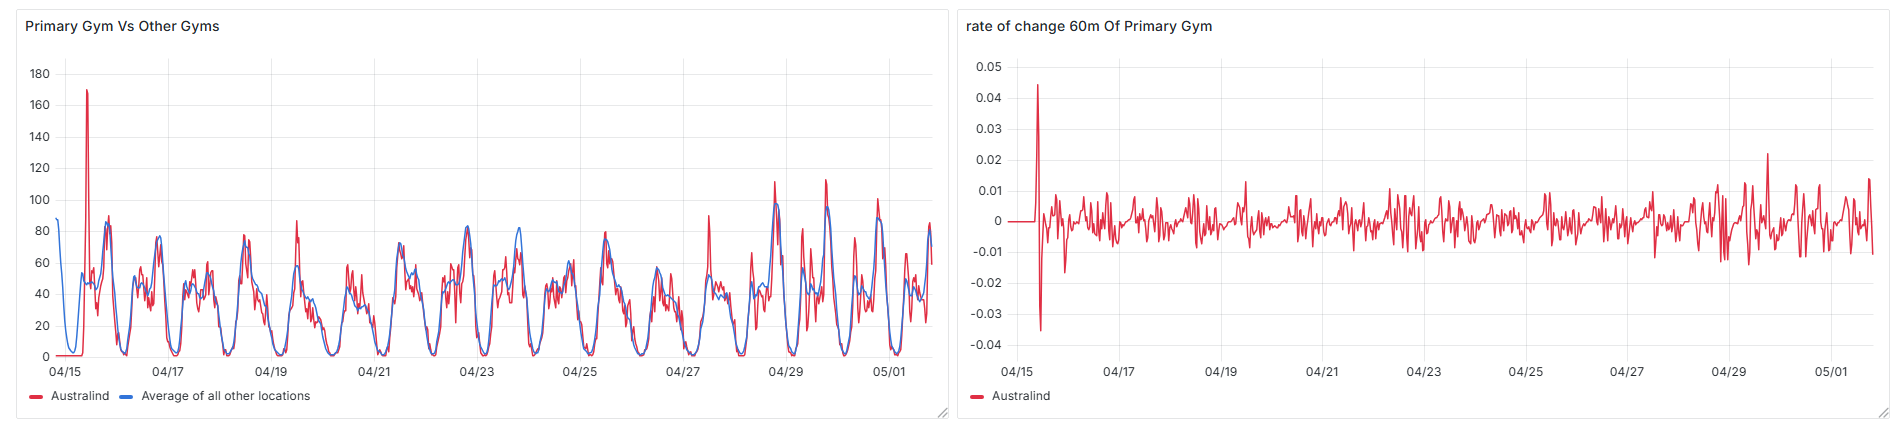
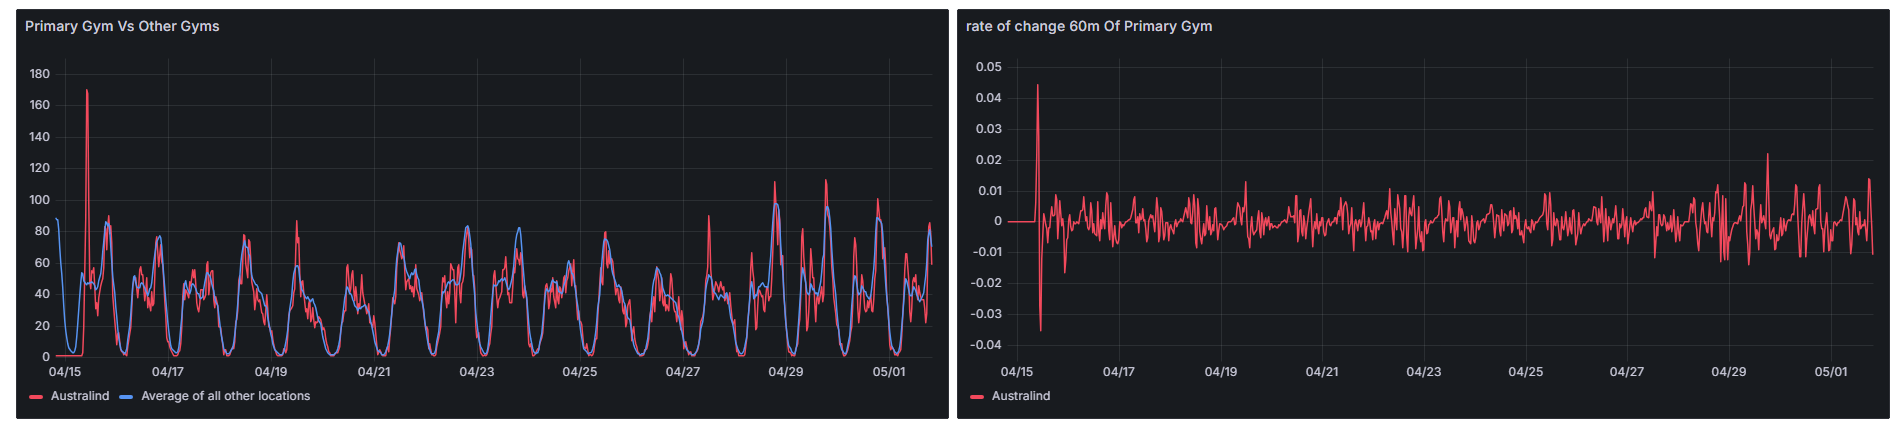
3. Anomalous Lows
These types of errors are typically caused by on-site issues at a specific location. In most cases, it’s due to a malfunctioning scanner. From what I’ve seen, this isn’t always a complete failure. Sometimes the scanner is still technically working, but only picks up one in every 20 check-in attempts.
When that happens, most gym goers won’t hang around and brute force the scanner with check-in attempts. They’ll either tailgate someone else through the gate or use an alternative entry method if available. As a result, the official check-in count ends up being much lower than it should be.
You can spot these anomalies by comparing that gym’s attendance trend against others. Since most REDACTED locations follow fairly consistent patterns throughout the day, a significant drop at one site stands out quickly. Another good way to detect it is by comparing week-on-week attendance. If a location suddenly shows far fewer entries on a day that normally sees heavy traffic, there’s a good chance something’s broken.
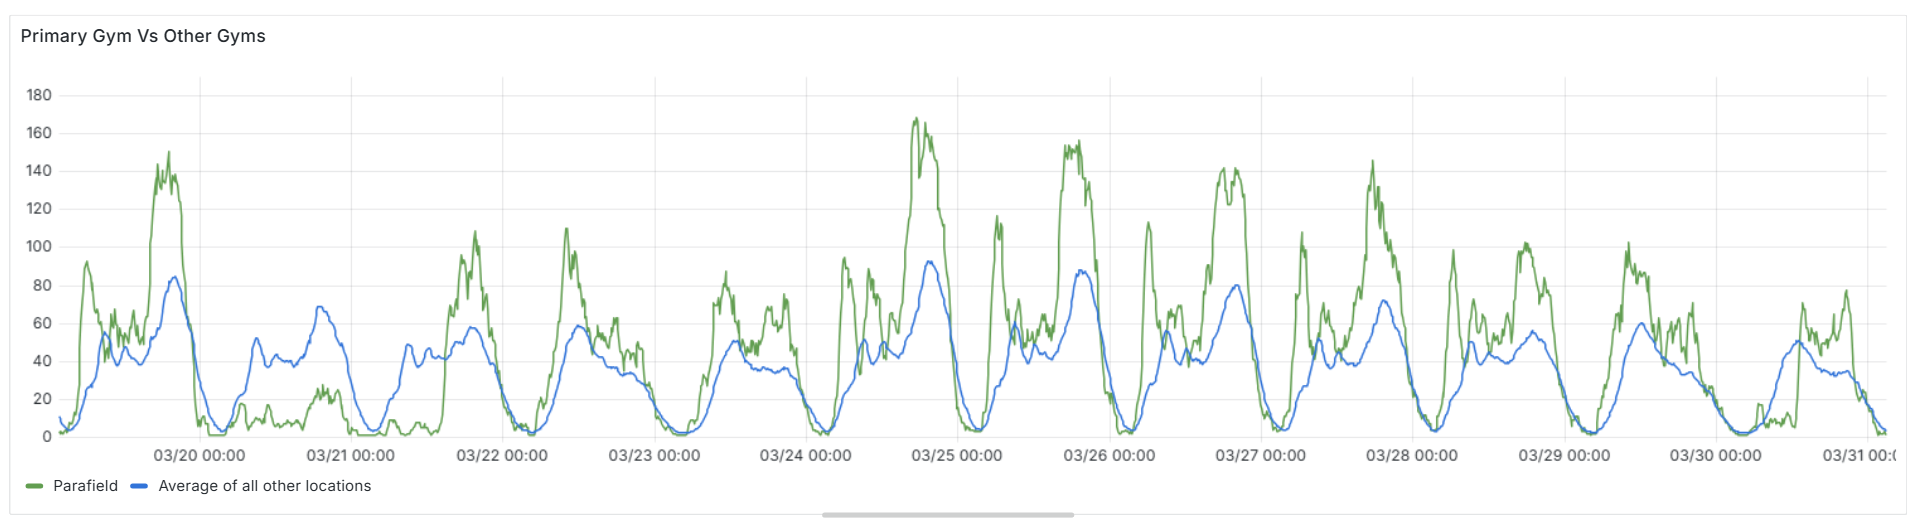
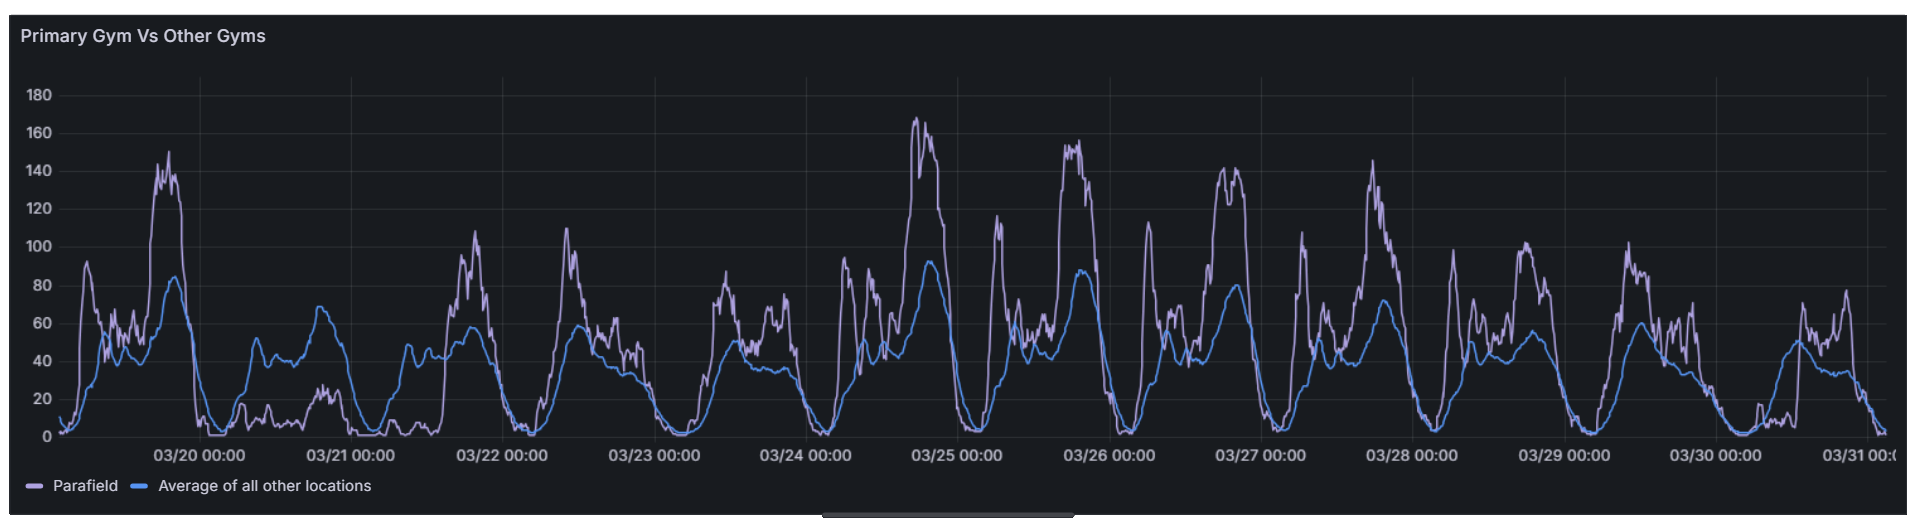 Example data from the Parafield location showing anomalously low attendance on the 20th and 30th of March
4. Non-erroneous Anomalies
Not all anomalies indicate something is broken. Sometimes, they reveal useful patterns hiding in plain sight. One of the most obvious examples is opening day for a new gym. These days almost always show the highest rate of change ever recorded for that location.
It makes sense, there’s a buzz, people are curious, and there’s often a launch event drawing a crowd. The result is a sharp and sudden surge in check-ins, far beyond what you’d expect on a normal day.
Unlike scanner faults or data outages, these spikes aren’t errors. But they stand out clearly when visualised alongside more typical daily trends, and they’re a great example of how rate-of-change metrics can surface significant real-world events.
Technical Details & Open Source
The entire project is available on GitHub: github.com/TravisPooley/RevoFitness-Attendance-Exporter
The core components include:
- A Python-based Prometheus exporter using BeautifulSoup for HTML parsing
- Docker configuration for easy deployment
- Grafana dashboard templates for immediate visualization
Installation is straightforward for anyone familiar with Docker and Prometheus. The repository includes detailed documentation on getting started, configuring the scraper for different gym chains (the code is adaptable beyond just REDACTED), and setting up alerting for specific thresholds.
I’ve designed the system to be lightweight, consuming minimal resources on even the most modest homelab setups. The entire stack can run comfortably on a Raspberry Pi or any small server.
Technical Implementation Deep Dive
Building the exporter required solving several technical challenges: reliable data extraction, proper Prometheus integration and robust error handling. Let me walk you through the key components that make this system work.
The Core Scraping Logic
The heart of the system is a Python-based collector that implements Prometheus’s custom collector interface. Rather than pre-collecting data at regular intervals, this approach scrapes fresh data every time Prometheus requests metrics, ensuring we never serve stale data.
1
2
3
4
5
6
7
8
9
10
11
12
13
14
15
16
17
18
19
20
21
22
23
24
25
26
27
28
29
30
31
32
33
34
35
36
37
38
39
40
41
42
43
44
45
46
47
48
49
50
51
52
53
54
55
56
57
58
59
60
61
62
63
64
65
class RevoFitnessGymCollector:
    """Collector to scrape Revo Fitness gym counts at scrape time."""

    def __init__(self, target_url, timeout=10):
        self.target_url = target_url
        self.timeout = timeout

        # Metrics for monitoring the scraper itself
        self.scrape_errors = Counter(
            'revo_fitness_scrape_errors_total',
            'Total number of scraping errors',
            ['error_type']
        )
        self.scrape_success = Counter(
            'revo_fitness_scrape_success_total',
            'Total number of successful scrapes'
        )
        self.scrape_duration = Histogram(
            'revo_fitness_scrape_duration_seconds',
            'Time spent scraping the Revo Fitness website'
        )

    def collect(self):
        """Dynamically collect metrics on each Prometheus scrape."""
        metric = GaugeMetricFamily(
            'revo_fitness_gym_count',
            'Live gym occupancy count',
            labels=['gym_name']
        )

        with self.scrape_duration.time():
            try:
                response = requests.get(
                    self.target_url,
                    timeout=self.timeout,
                    headers={'User-Agent': 'Prometheus-Exporter-RevoFitness/1.0'}
                )
                response.raise_for_status()
                soup = BeautifulSoup(response.text, 'html.parser')
                count_data = {}

                # Extract gym counts from span elements
                for span in soup.find_all('span', attrs={'data-live-count': True}):
                    gym_name = span['data-live-count'].strip()
                    try:
                        count = int(span.text.strip())
                    except ValueError:
                        count = -1  # Invalid data marker
                    count_data[gym_name] = count

                # Add metrics for each gym
                for gym_name, count in count_data.items():
                    metric.add_metric([gym_name], count)

                self.scrape_success.inc()
                logger.info(f"Successfully scraped {len(count_data)} gyms.")

            except requests.RequestException as e:
                self.scrape_errors.labels(error_type=type(e).__name__).inc()
                logger.error(f"Request error: {e}")
            except Exception as e:
                self.scrape_errors.labels(error_type=type(e).__name__).inc()
                logger.error(f"Unexpected error: {e}")

        yield metric
The key insight here is using BeautifulSoup to parse the HTML and extract data from elements with the data-live-count attribute. This approach is resilient to minor HTML changes and provides clean separation between gym names and their counts.
Prometheus Integration
I tried to build the exporter so it follows Prometheus best practices by implementing a custom collector rather than using static metrics. This ensures that each scrape gets fresh data and that we can monitor the scraper’s own performance:
- Scrape duration: Tracks how long each scrape takes
- Success/error counters: Monitor scraping reliability
- Error type labels: categorise different failure modes
The main application loop is intentionally simple:
1
2
3
4
5
6
7
8
9
10
11
12
13
14
15
16
17
18
19
def main():
    parser = argparse.ArgumentParser(description='Revo Fitness Gym Count Prometheus Exporter')
    parser.add_argument('--port', type=int, default=8000, help='Port to serve metrics on')
    parser.add_argument('--timeout', type=int, default=10, help='HTTP request timeout in seconds')
    parser.add_argument('--log-level', choices=['DEBUG', 'INFO', 'WARNING', 'ERROR'], default='INFO')
    args = parser.parse_args()

    target_url = "https://revofitness.com.au/livemembercount/"
    collector = RevoFitnessGymCollector(target_url, args.timeout)
    REGISTRY.register(collector)

    start_http_server(args.port)
    logger.info(f"Exporter running on port {args.port}")

    try:
        while True:
            time.sleep(1)
    except KeyboardInterrupt:
        logger.info("Exporter stopped.")
Containerisation for Reliability
To ensure the exporter runs consistently across different environments, I’ve containerised it using Docker. The Dockerfile is deliberately minimal:
1
2
3
4
5
6
7
8
9
10
11
12
FROM python:3.13-slim

WORKDIR /app

COPY requirements.txt .
RUN pip install --no-cache-dir -r requirements.txt

COPY revo_fitness_exporter.py .

EXPOSE 8920

CMD ["python", "revo_fitness_exporter.py", "--port", "8920", "--timeout", "50"]
This approach provides several benefits:
- Consistency: The same environment regardless of host system
- Isolation: Dependencies don’t conflict with other applications
- Easy deployment: Single command to get everything running
- Resource efficiency: Python slim image keeps the container small
Error Handling and Resilience
The scraper includes comprehensive error handling for common failure scenarios:
Network Issues: Timeouts and connection errors are caught and logged, but don’t crash the exporter. Prometheus will simply get no new data points for that scrape interval.
Parsing Errors: If the HTML structure changes or contains unexpected data, the scraper gracefully handles it by setting count values to -1, making it easy to identify data quality issues in Grafana.
Rate Limiting: The user-agent header helps identify the scraper as a monitoring tool rather than a bot, hopefully reducing the likelihood of being blocked.
Deployment Configuration
In my homelab setup, the exporter runs as a Docker container with these key configurations, the Prometheus configuration is equally straightforward:
1
2
3
4
5
6
7
# prometheus.yml excerpt
scrape_configs:
  - job_name: 'revo-fitness'
    static_configs:
      - targets: ['revo-fitness-exporter:8920']
    scrape_interval: 5m
    scrape_timeout: 30s
Performance Considerations
The exporter is designed to be lightweight and efficient:
- Minimal dependencies: Only requests, BeautifulSoup, and prometheus_client
- Low memory footprint: No data caching or complex state management
- Fast scraping: Typically completes in under 2 seconds
- Configurable timeouts: Prevents hanging requests from affecting Prometheus
The 5-minute scrape interval provides good temporal resolution for attendance patterns while being respectful of REDACTED’s servers. For detecting rapid anomalies like evacuations, this frequency is sufficient since such events typically unfold over several minutes.
Data Quality and Validation
One crucial aspect of the implementation is data validation. The system handles several edge cases:
- Missing gyms: If a location disappears from the HTML (like during closures), it simply stops reporting metrics
- Invalid counts: Non-numeric values are converted to -1 for easy identification
- Network failures: Temporary outages don’t crash the exporter
This robust error handling ensures that temporary issues don’t corrupt the historical data or bring down the monitoring system.
Conclusion
What began as a sceptical investigation into gym counter accuracy has evolved into a fascinating data project. Along the way, I’ve gained valuable insights into gym attendance patterns, honed my data visualisation skills, and created a useful tool for optimising my workout schedule.
If you’re interested in gym attendance patterns or looking to build similar data collection tools, I encourage you to check out the repository, try it yourself. Sometimes, the most interesting projects come from questioning the accuracy of the everyday systems we take for granted. In this case, a simple doubt about gym attendance counters led to a project that continues to provide valuable insights many months later.